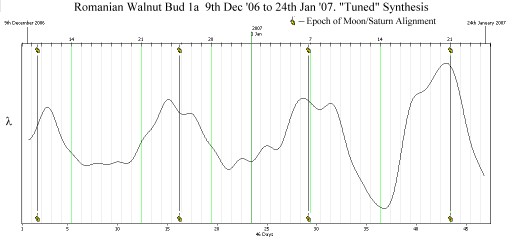
 The chart at the top
left depicts a "tuned", or filtered, version of
the λ
variation of the Romanian Walnut bud, Bud1a, as it had manifested until
24th January, 2007.
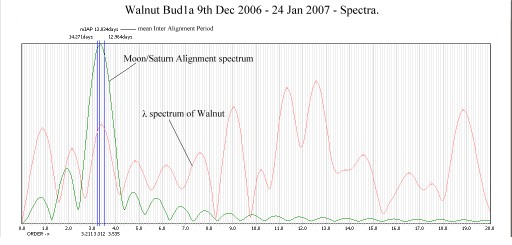
Fourier
Analysis of the λ variation of the Walnut bud
produces the
spectrum
shown on the left. Superimposed in green on this spectrum is
the similarly-produced spectrum
of the alignment of the Moon
with
Saturn. The latter shows many peaks,
but the highest
of them is the important one. It is the "dominant",
representing the period, or frequency, holding most of the "energy" of
variation. Not very surprisingly, it is close to the mean
Inter-Alignment Period (mIAP) for the time span of this
particular
series. It will be seen that there is a significant peak of λ "energy" co-inciding almost exactly with the Moon/Saturn
dominant.
We might therefore expect
to see variation in the actual λ chart
corresponding to it. We would expect peaks or dips at the same
intervals as the Saturn/Moon alignments. And, were
it not for the many other spectral peaks, we would indeed see
them.
But there is a lot going on with the shape of this bud.
Other rhythms are present, besides the one in which we are
interested, that obscure them.
A spectrum is in
effect just the list of simple, sinusoidal components
which sum to the original data, presented as a graph. The
process of compiling the list is called Fourier
Analysis.
The process of actually summing the components is called Fourier
Synthesis.
If we have the list, then we can often isolate the spectral
peaks that contain the components of most interest, simply by omitting
from the synthesis those components of the spectrum that do not belong
to those peaks. But for all sorts of reasons it is not good
to chop up the spectrum abruptly. The discontinuities
introduce falsifying spuriae into the synthesis. It is better
to run unwanted portions to zero gently, without discontinuity.
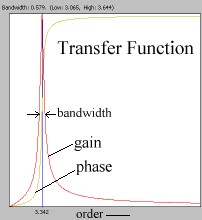
Here we have
used a tuned
filter to accomplish this. It is a computer
analogue of the electrical circuit shown above right, and makes use of
resonance. Its response can be tailored to make it
more or less selective over a definable range of frequencies. The
actual transfer function used on the Walnut spectrum is shown above the circuit. This
filter was tuned precisely to the dominant of Moon/Saturn,
made moderately selective, and applied to the Walnut's λ
spectrum.
The synthesis of
its output is the chart at the top left.
It is at once obvious
from it that there is a λ rhythm in the
Walnut corresponding well to the Moon/Saturn rhythm. Indeed
the peaks of it broadly co-incide in time with the actual Saturn
alignments - though the troughs do not. They tend to come about 8 to 9 days in advance of the
Saturn alignments (that is, they have a phase shift of
perhaps -9 days). Whichever of these - peak or trough -
turns out to be the properly significant event for this bud, the
general
rhythm seems to be settling on Saturn, which we therefore provisionally
take to be this bud's acknowledged planet. Time and more data
will say whether or not this is justified.
Home Site Map
Band Pass by Fourier Methods Final Tuned λ Chart on Walnut Bud 1a
Download "Band Pass by Fourier Methods", by G. Calderwood (zipped "Word" document).


